Monitoring Lambda with CloudWatch Logs
By the end of this lesson, you'll be able to:
- Explain what CloudWatch logs, metrics, and tracing each provide for a Lambda function
- Explain cold starts conceptually, without overstating them as a universal problem
- Explain why Lambda's own execution environment is not durable application storage
Prerequisites: "Lambda Triggers: S3 Events and DynamoDB Integration"
CloudWatch: logs, metrics, and invocation count
Amazon CloudWatch collects observability data for a Lambda function automatically, without extra setup for the basics:
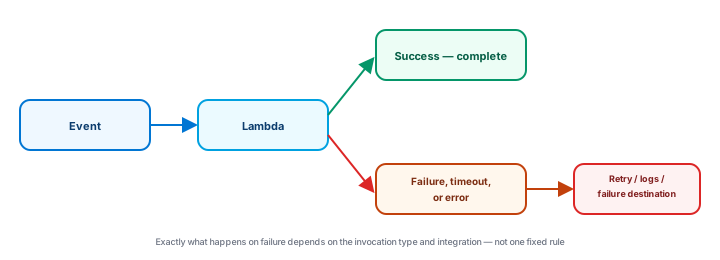
- Logs — anything the function writes during execution (including uncaught errors) is captured as log output, viewable per invocation.
- Metrics — numeric measurements over time, including invocation count, error count, and duration (how long each invocation actually took).
- Tracing — for more complex applications with several services involved, distributed tracing can show how a single request moved through multiple components — this lesson introduces the concept rather than a specific tracing tool's setup.
This lesson doesn't walk through the current CloudWatch Console UI, since AWS's interface changes over time — the durable, beginner-level takeaway is the categories of observability data available (logs, metrics, traces) and why each matters: logs for "what exactly happened," metrics for "how is this behaving in aggregate," and duration/error metrics specifically for catching problems before they're reported by users.
Cold starts: an occasional initialization delay
A Lambda function sometimes requires initialization before it can handle an invocation — setting up its execution environment for the first time (or the first time in a while). This initialization step, commonly called a cold start, can add latency to that specific invocation.
This lesson deliberately avoids stating a specific delay figure — the actual impact varies by runtime, function size, configuration, and how often the function is invoked, and quoting a fixed number here would likely be wrong or outdated by the time it's read. The practical takeaway: cold starts are a real, occasional characteristic of serverless compute worth being aware of, not a universal, constant problem that affects every invocation of every function equally.
Lambda's own execution environment is not durable storage
This is worth stating directly, since it trips up developers new to serverless: anything a Lambda function stores only in its own local filesystem or in-memory state during one invocation should not be treated as durable application storage. A function's execution environment can be reused across invocations sometimes, or not — this isn't something application logic should depend on either way.
Durable application state belongs in a service built for it: DynamoDB or RDS/Aurora (Module 5) for structured data, S3 (Module 4) for files and objects. A Lambda function should read whatever state it needs from one of those services at the start of an invocation, and write back to one of them before finishing — never assume anything written only to the function's own local environment will still be there next time.
Exercise
A developer notices their Lambda function's first invocation after a period of inactivity is noticeably slower than later invocations. Using this lesson's concepts, name what this is called, and explain why this lesson deliberately doesn't quote a specific delay figure for it. Then explain what's wrong with a different function that writes a counter value to a local file inside its own execution environment, expecting that value to persist across every future invocation.
Show hint
The first part is the cold-start concept; the second part is about why Lambda's own environment isn't durable storage.
Monitoring Lambda with CloudWatch Logs Quiz
My Notes
Log in to keep private notes on this lesson.
Questions about this lesson
No questions yet — be the first to ask.
Log in to ask a question about this lesson.
Summary
Amazon CloudWatch collects the logs, metrics, and (optionally) traces a Lambda function produces — errors, duration, and invocation count among them — giving the observability needed to understand how a function is actually behaving in production, while cold starts (an occasional initialization delay) and the function's own non-durable execution environment are two further beginner-level concepts worth understanding early.