Amazon CloudWatch: Logs and Metrics
By the end of this lesson, you'll be able to:
- Explain why operational visibility matters once an application is running in production
- Distinguish a metric (a numeric measurement over time) from a log (a detailed event record)
- Describe what makes a log entry actually useful for investigating a problem, and what should never appear in one
Prerequisites: Module 9: "Project: Deploy a Containerized Application"
Why observability matters once something is actually running
Every module so far in this course has focused on building something — a database, a network, a container deployment. Once that thing is actually running and serving real traffic, a different question takes over: is it working correctly right now, and how would you know if it wasn't? Without deliberate observability, the honest answer is often "we'd find out when a user complains" — not a position any team wants to be in.
Metrics: numeric measurements over time
A metric is a numeric measurement recorded over time — request count, CPU utilization, error count, and latency are all metrics. A metric has a name, a value, and a timestamp, and can optionally be broken down by dimensions (for example, the same "error count" metric reported separately per API route). Metrics are what let you notice a change — "error count just jumped" — without needing to read a single individual event.
Logs: detailed event records
A log is a detailed record of a specific event — an application error, a request being processed, a service starting up. Where a metric tells you that something changed, a log can help explain what actually happened in one specific instance.
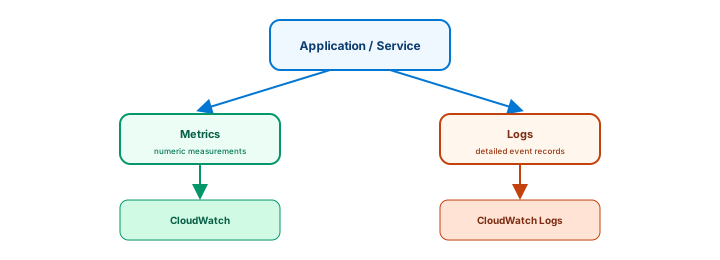
Amazon CloudWatch is AWS's operational monitoring service for exactly this — metrics flow into CloudWatch, and logs flow into CloudWatch Logs, giving a single place to look for both.
What makes a log entry actually useful — and what should never be in one
A genuinely useful log entry helps answer: what happened, where, when, for which specific request or work item, whether it succeeded, and what category of error occurred if it didn't. Structured logging — writing log entries as consistent, labeled fields rather than free-form sentences — makes this dramatically easier to search and correlate later. A fictional, deliberately safe example:
{
  "level": "ERROR",
  "event": "CourseEnrollmentFailed",
  "requestId": "req-demo-123",
  "reason": "DatabaseTimeout"
}
This is a fictional example with no real user data — the point is the shape: consistent field names (level, event, requestId, reason) make it possible to search for every CourseEnrollmentFailed event, or every event tied to one specific requestId, instead of hunting through free-form text.
Just as important as what a good log contains is what it must never contain: passwords, access keys, tokens, complete secrets of any kind, or unnecessary personal information. A log is often readable by more people than the data inside it should be — security applies to logs exactly as it applies to anywhere else data is stored.
Exercise
For each of the following, decide whether it's a metric or a log: (1) "request count increased from 200 to 4,000 in the last five minutes," (2) "user request req-8821 failed with a DatabaseTimeout error at 14:32:07." Then explain why a rising error-count metric alone might not tell you *why* errors are happening, and what you'd look at next to find out.
Show hint
One of these is a number changing over time; the other is a specific, detailed record of one event. The follow-up question is about what logs give you that metrics don't.
Amazon CloudWatch: Logs and Metrics Quiz
My Notes
Log in to keep private notes on this lesson.
Questions about this lesson
No questions yet — be the first to ask.
Log in to ask a question about this lesson.
Summary
Once an application is running in production, the only way to know how it's actually behaving is through observability — Amazon CloudWatch collects metrics, numeric measurements over time that tell you something changed, and logs, detailed event records that can help explain what happened, with both flowing into CloudWatch from the application or AWS service producing them.