Monitoring the Application: CloudWatch
By the end of this lesson, you'll be able to:
- Explain the difference between what CloudWatch answers and what CloudTrail answers for this application
- Describe at least four realistic failure scenarios for this capstone and the control that addresses each
- Explain why observability should reveal a problem before a learner reports it
Prerequisites: "Securing the Application: IAM Roles and Policies"
CloudWatch and CloudTrail answer different questions
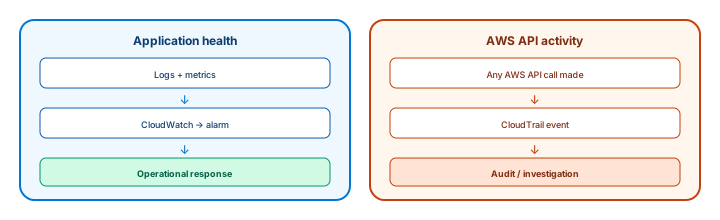
Module 10 introduced this distinction; here it applies directly to the capstone. CloudWatch collects this application's logs and metrics — Lambda invocation errors, invocation duration, DynamoDB throttling, SQS queue depth — and can raise an alarm when a metric crosses a defined threshold, triggering an operational response. CloudTrail (Lesson 5) instead records AWS API activity: who created, modified, or deleted a resource. The question worth asking before choosing either: is this "is the application currently healthy?" (CloudWatch) or "who or what changed this resource, and when?" (CloudTrail)?
The standard this lesson holds the design to: how will the team know the application is unhealthy before a learner reports it? An alarm on Lambda error rate, or on SQS queue depth growing past a healthy threshold, answers that question. Waiting for a support ticket does not.
Failure analysis: different failures, different controls
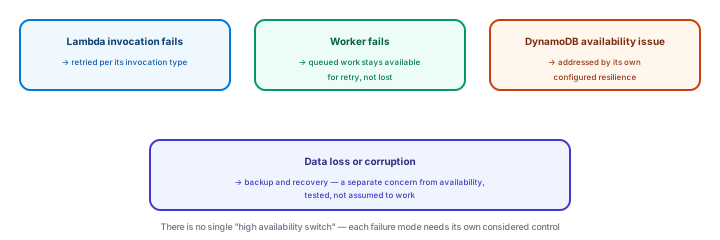
Realistic failure scenarios for this capstone, and what actually addresses each — the goal here is reasoning about failure, not a guarantee of zero failures:
- A Lambda invocation fails. It is retried according to its invocation type and configuration; a CloudWatch alarm on the function's error rate surfaces a pattern of failures, not just one transient error.
- An Availability Zone becomes unavailable. Because the application's compute is serverless and DynamoDB is a managed, multi-AZ service, this scenario is substantially absorbed by the managed services themselves — a different resilience story than Module 12's EC2/load-balancer pattern, worth stating explicitly rather than assuming it's identical.
- The certificate-generation worker fails. The underlying SQS message remains available for another attempt rather than being lost — provided the worker is idempotent (Lesson 3).
- The certificate queue backlog grows. A CloudWatch alarm on queue depth surfaces this before certificates are simply "slow" with no visible cause.
- DynamoDB experiences a brief availability issue. Addressed by DynamoDB's own configured resilience — a separate concern from backup and recovery, which protects against data loss or corruption, not infrastructure unavailability.
- A deployment fails partway through. This is exactly what Lesson 7's IaC change-preview step exists to catch before it reaches production, and why a stack's rollback behavior matters.
- Credentials are accidentally exposed. Addressed by Lesson 5's secrets-management and least-privilege design — the blast radius of an exposed, narrowly-scoped credential is far smaller than an exposed broad one.
There is no single "make it highly available" switch that covers all seven of these — each needs its own considered, named control.
Exercise
Design one CloudWatch alarm for this capstone that would reveal a real problem before a learner reports it. State the specific metric, a plausible threshold, and what operational response the alarm should trigger.
Show hint
SQS queue depth for the certificate-generation queue, and Lambda error rate for the API functions, are both good candidates — pick one and be specific about the threshold and response.
Monitoring the Application: CloudWatch Quiz
My Notes
Log in to keep private notes on this lesson.
Questions about this lesson
No questions yet — be the first to ask.
Log in to ask a question about this lesson.
Summary
CloudWatch answers whether the application itself is healthy — using logs, metrics, and alarms that should surface a problem before a learner reports it — while CloudTrail (Lesson 5) separately answers who or what changed an AWS resource; and this capstone's realistic failure scenarios — a Lambda invocation failing, an Availability Zone becoming unavailable, a worker failing, a queue backlog growing, DynamoDB becoming briefly unavailable, a deployment failing, or credentials being exposed — each need their own specific control rather than one universal "high availability" fix.